Business intelligence · Concept dashboards
A dashboard should end in a decision.
A dashboard isn’t a report with colors. It’s an instrument someone checks every morning because it answers their question faster than asking. Each of these is built for one fictional company, runs on synthetic data, and goes past the chart to the decision and what happens after it.
The dashboards
From a number to a decision.
Trace a number to its cause, compare the options, approve one and watch what it does. More open here as each one is finished.
-
 Powersports dealer group · Demand to Action
Redline Powersports
Shows where sales went and which recovery plan keeps the margin.
- What works
- Trace a sales drop to its cause, compare four recovery plans, approve one and replay thirty days of results.
- How it’s built
- Every number comes from one synthetic data set, and every chart, plan and approval works in the browser.
-
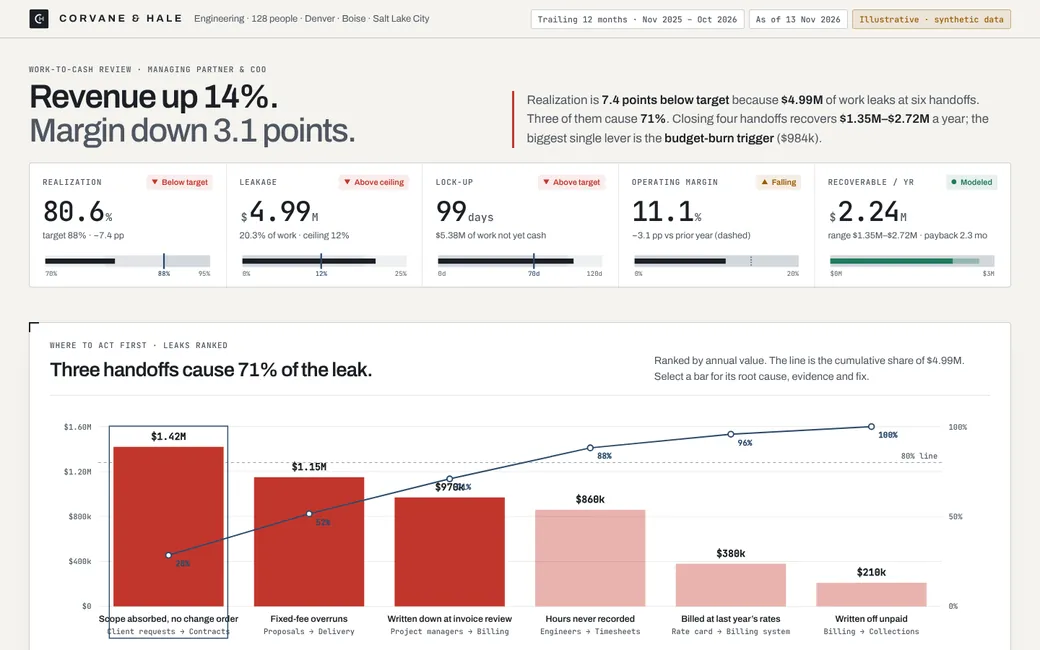 Engineering firm · Work to Cash
Corvane & Hale
Shows where billable work leaks between the timesheet and the invoice.
- What works
- Follow twelve months of work through six handoffs, see what leaked at each one, and weigh the fixes.
- How it’s built
- One synthetic ledger drives the 3D waterfall, the flow and the project list, so every view shows the same money.
-
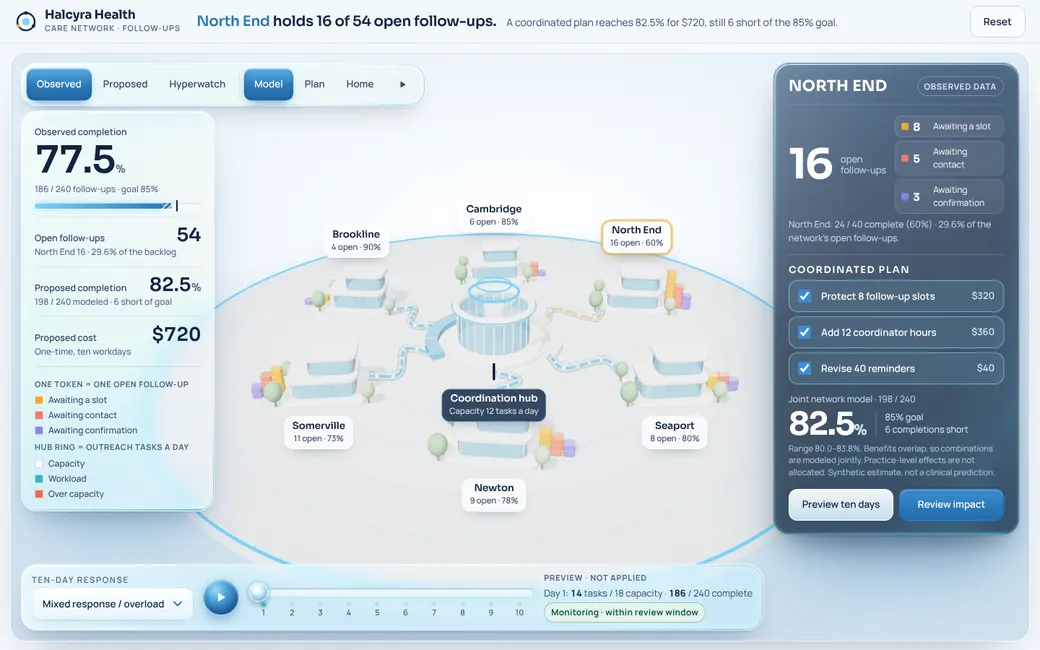 Healthcare network · Care Network
Halcyra Health
Shows where follow-up breaks down between visits, and who can close the gap.
- What works
- Pick a practice, build a three-action plan with its real overlap, and replay ten days, including a day the data goes missing.
- How it’s built
- One synthetic data set drives the glass model, the plan view and the table.
-
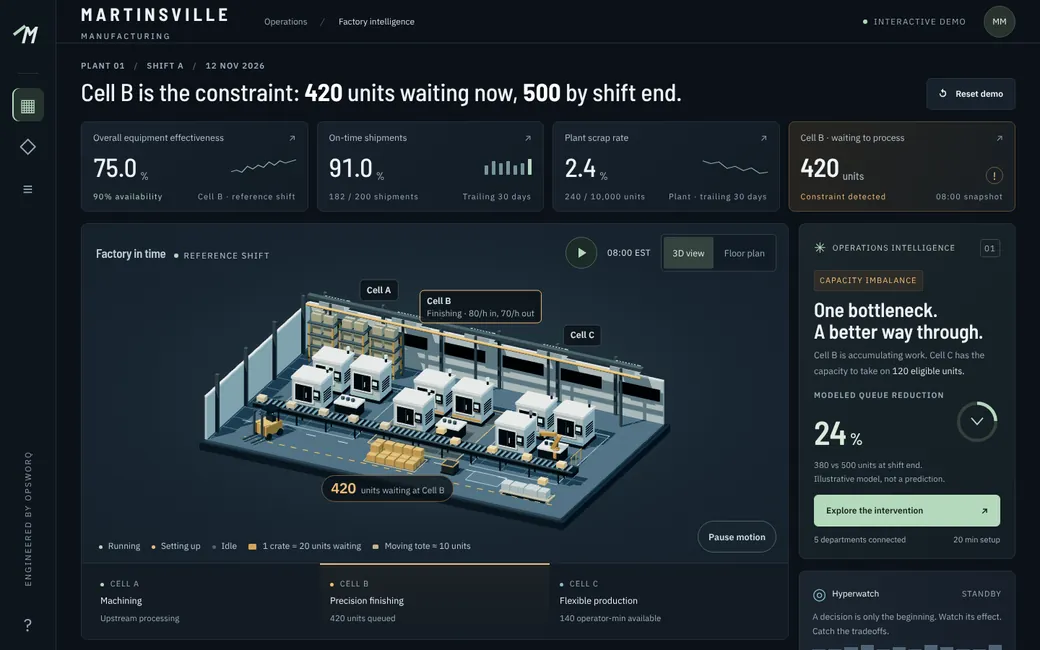 Manufacturer · Factory in Time
Martinsville Manufacturing
Shows which bottleneck threatens today’s shipments, replayed across the shift.
- What works
- Scrub the shift, test a reroute against a quality hold, and take it through both approvals.
- How it’s built
- The 3D factory and the floor plan run on the same synthetic event ledger.
-
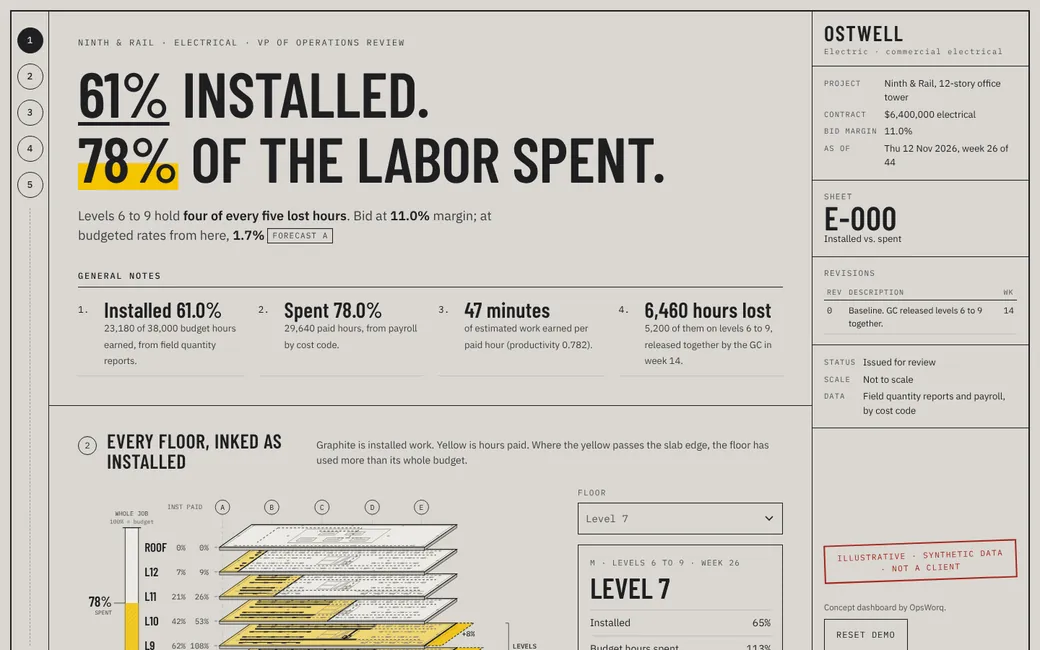 Electrical contractor · Installed vs. Spent
Ostwell Electric
Shows labor spent against work installed, floor by floor, week by week.
- What works
- Play the job week by week, open any floor, and set the two margin forecasts side by side.
- How it’s built
- Drawn in SVG from one synthetic job file, so it works without 3D on any screen.
-
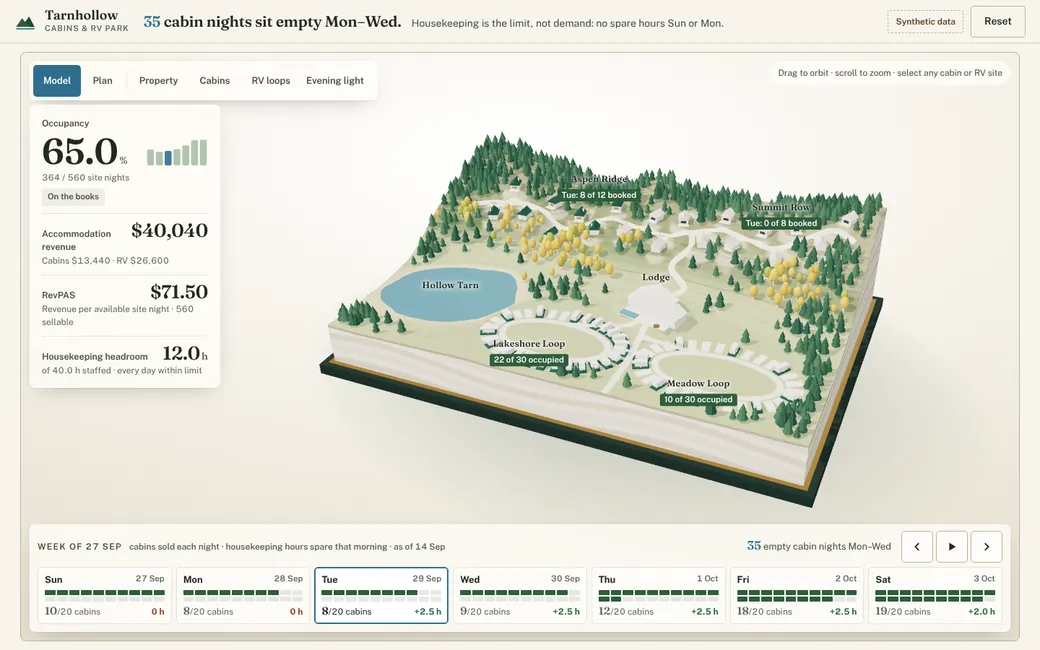 Cabins & RV park · Living Property
Tarnhollow
Shows which nights sit empty and what housekeeping can carry.
- What works
- Compare holding the course, a two-night package and a discount, each checked against the hours housekeeping has.
- How it’s built
- The 3D park, the night strip and the planner share one synthetic booking file.
Every company here is fictional, and every name was checked against real businesses before we used it. Every figure is synthetic and labeled that way on screen. Nothing typed into a dashboard is sent anywhere.
Your numbers
Tell us the question you’d answer every morning.
What you decide, how often, and where the numbers live today. A sentence is plenty. A person replies within one business day.
1‑855‑OPSWORQ855‑677‑9677 · Mon–Fri, 8am–5pm ET
What can we help with?
Three short steps. A person replies within one business day.
The whole system
One layer
- IntelligenceSee it coming: the numbers on one screen, forecasts, decisions tested first.From your reading
- OperationsMake the work flow: processes, SOPs, CRM, automation and compliance.From your reading
- ContinuityNothing stops you for long: backup, recovery, and plans that have been tested.From your reading
- SecurityWhat’s yours stays yours: every login, laptop and inbox.From your reading
- Infrastructure and supportIt just works: help desk, repair, networks, Microsoft 365, phones.From your reading
Around it